Calibration Curves for Saccharides (NH2P-50)
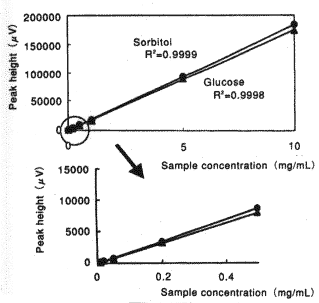
Sample : 20micro-L
|
Correlation Coefficient
(0.2 to 200micro-g) |
|
| Glucose | 0.9998 |
| Sorbitol | 0.9999 |
| Fructose | 0.9998 |
| Sucrose | 0.9999 |
| Lactose | 0.9997 |
| Maltose | 0.9998 |
| meso-Erythritol | 0.9999 |
| Xylitol | 0.9999 |
| Mannitol | 0.9999 |
| Maltitol | 0.9997 |
Column       : Shodex Asahipak NH2P-50 4E (4.6mmID*250mm)
Eluent       : CH3CN/H2O=75/25
Flow rate    : 1.0mL/min
Detector     : Shodex RI
Column temp. : 25deg-C