Analysis of Synthetic Polymers Using Linear Type Column LF-804 (OUTLINE)
2. Chromatograms of Phenol resin
3. Separation conditions of Phenol resin (1)
4. Separation conditions of Phenol resin (2)
5. Separation conditions of EPON 1009
6. Size expansion of EPON 1009 in DMF
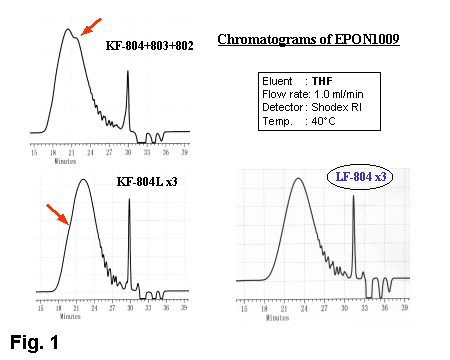
1. Features of LF-804
When three grades of organic SEC (GPC) columns, each of which has a different exclusion limit were used in series, an unnatural bump was apparently generated on the chromatogram. While using so-called mixed-bed columns packed with several grades of particles in optimum proportions, the shape of the peak has improved to some extent. However to check the chromatogram in detail, a slight shoulder is observed. It seems due to the fact that a linear calibration curve cannot be obtained only by mixing different types of particles. On the contrary, by using GPC LF-804 column, a very natural-shaped peak with no bumps or distortion was obtained. This column is manufactured by packing with a single grade of particles, each of which has a broad pore size distribution. Consequently, its calibration curve is very linear over a molecular range from 300 to 2,000,000. That is why no unnatural distortion is generated on the chromatogram.(Fig.1)
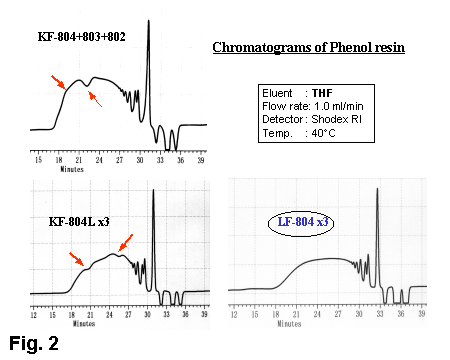
2. Chromatograms of Phenol resin
When analyzing a phenol resin, a more remarkable difference was observed. Based on such chromatograms having big distortions, it is difficult to gain a accurate calibration curve. Using a broad pore size distribution column like the LF-804, we can easily prevent the generation of bumps and distortions . (Fig.2)
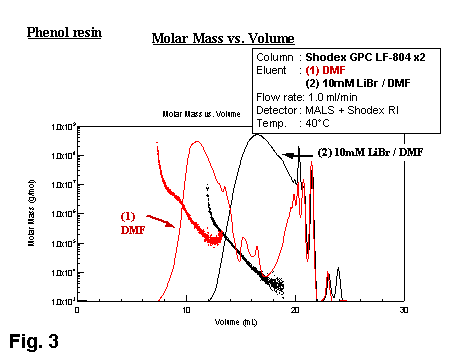
3. Separation conditions of Phenol resin (1) ; DMF and 10mM LiBr in DMF
For phenol resins, an abnormal shape of chromatogram occurs in DMF without the addition of salt. Only after the addition of 10mM LiBr does the accurate measurement of the molecular weight distribution become possible. (Fig.3)
4. Separation conditions of Phenol resin (2) ; THF and 10mM LiBr in DMF
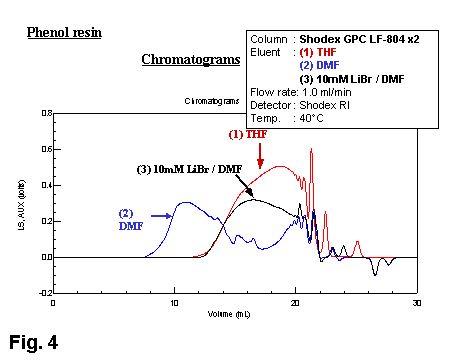
The chromatogram in THF was superimposed upon that in DMF added 10mM LiBr. By comparison, the peaktop in THF is shifting backward. Consequently, it is assumed that the molecular size of the phenol resin in THF is a little smaller, because it elutes a little later than in LiBr-added DMF. (Fig.4)
5. Separation conditions of melamine resin (EPON 1009)
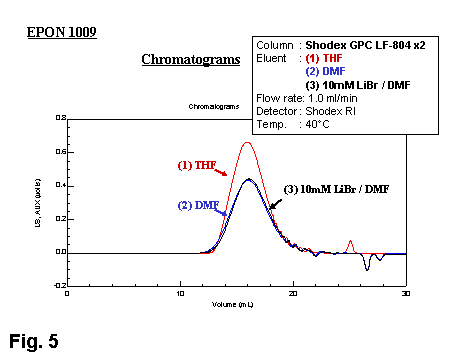
The chromatograms, analyzed with THF, DMF or 10mM LiBr in DMF, were superimposed . In the every case, a natural peak with very good symmetry was obtained. Moreover, the eluting positions were almost same. From these results, we can conclude that the size of one molecule of EPON 1009 in DMF is almost same as that in THF. (Fig.5)
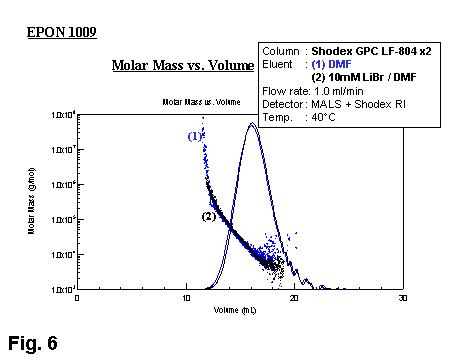
6. Size expansion of EPON 1009 in DMF
Since the LF-804 column can be used with different solvents, we attempted to analyze the same samples using DMF as the eluent. Looking at the chromatogram derived from the RI detector, we see that normal peaks were obtained even without the addition of LiBr. However, the molecular weight plots obtained by MALS are more widely distributed in DMF compared with the case in LiBr-added DMF. The difference suggests that a size expansion of the molecules is taking place to some extent. (Fig.6)
