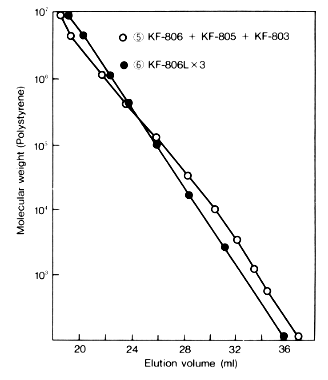
Comparison of Calibration Curves: Linear Type and Column Connection
When two or three different columns (non linear type) are connected in series,
it is difficult to obtain a complete linear calibration curve. On the other hand,
an linear calibration curve can be obtained, when the same linear type columns
are connected in series. The above table shows the mean error (%) for each combination
of columns. The calibration curves were determined by the method of least squares
with cubic equations. The mean error (%) was obtained by taking the average of
the errors in molecular weight compared to molecular weight read from the calibration
curves with actual molecular weights of the six polystyrene standards. Connection
of three linear type column, GPC
KF-806L gave the smallest
error.

Sample :
PS, Polystyrene
Combination of
Column |
Mean %
Error in M |
Correlation
Coefficient |
|
KF-805 + KF-804
|
14.68 |
0.9996 |
|
KF-806 + KF-803
|
6.79 |
0.9999 |
|
KF-806 + KF-804
|
11.47 |
0.9997 |
|
KF-806 + KF-805
+ KF-803
|
4.38 |
0.9999 |
|
KF-806L x 3
|
2.54 |
1.0000 |
Columns   : Shodex GPC KF-806 + KF-805 + KF-803, KF-806L x 3 (8.0mmID*300mm each)
Eluent    : THF
Flow rate : 1.0mL/min
